Overview of Chapter One
Data Analysis & Decision Making with Microsoft Excel
The Problem
v Today’s business environment
is more complex than ever
v Technology has made it
possible to collect huge amount of data
v Raw data is not useful to
business, the information implicit in the data is
v Success in business depends on how well you can isolate and act on this information
The Solution
Ø
Use technology
to bring the power of quantitative analysis to your decision making
Ø
Quantitative
methods allow us to proceed rationally:
o When datasets are
overwhelming large
o When we have incomplete
information
o When we need to predict future trends from historical fact
The Approach
Ø Combine and integrate the
techniques of both statistics and management science
Ø
This yields a
useful collection of quantitative methods for analyzing data and making
business decisions
Ø Use spreadsheets to eliminate the onerous elements of quantitative analysis
The Techniques
Pooling quantitative methods
from both Statistics and Management Science yields a rich set of methods for
both extracting strategic information from data and making business decisions:
Ø
Probability
Theory –
provides formal methods for dealing with uncertainty
Ø
Statistical
Analysis –
provides ways to summarize large data sets
Ø
Sampling – provides effective ways
to work with large data sets
Ø
Statistical
Process Control – applying statistics to quality control
Ø
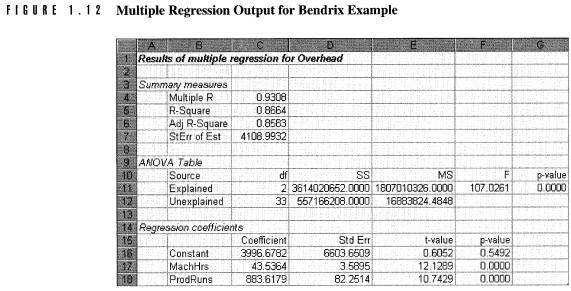
Regression
Analysis –
analyzes relationships between variables
Ø
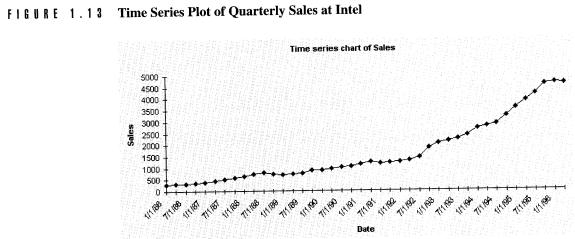
Time Series
Analysis –
analyzing events over time
Ø
Extrapolation – predicting future trends
from historical fact
Ø Spreadsheet Optimization – determining optimal outcomes by optimizing spreadsheet models of the business
The Software
Ø
Microsoft
Excel
Excel is
a very powerful, flexible, and easy-to-use spreadsheet package. It is already
in-use at most companies, and can be effectively put to use in applying
quantitative methods to business problems.
Ø Microsoft Excel Add-ins
Specialized add-ins expand Excel’s ability to perform
quantitative analysis, making it a one-stop-shop for business analysis.
o Solver Add-in – performs spreadsheet
optimization
o StatPro Add-in – creates graphs used in
basic statistical analysis
o RandFn Add-in – generates random values
for standard probability distributions
o SolverTable Add-in – tracks changes in the optimal
solution as variables change
o @Risk – automates running many
iterations of a spreadsheet simulation
o PrecisionTree – creates decision trees
and performs sensitivity analyses
o TopRank – ranks inputs to a model
using sensitivity analyses
o BestFit – determines the most
appropriate probability distribution for a model
o RiskView – graphs probability distributions
The Models
Ø Modeling Process
While developing
models to solve problems, a seven-step process is used very commonly and these
steps are:
1.
Define the problem. The company must be sure that it has identified the rigth problem
before start working on it.
2.
Collect and summarize data. It is very important for the analyst to gather
exactly the right data and summarize it appropriately for use in the model.
3.
Formulate model. There are different kinds of models that can be applied. But,
whichever is chosen, the way it captures the key elements of the problem should
be understandable by all parties involved.
4.
Verify the model. Analyst verifies the model by checking if the model developed
represents the reality. He/she can use the real data of the company and the
results to check the models validity, or he/she can enter a number of random
inputs and look for reasonable outputs.
5.
Select one or more suitable decisions. If the model is working
properly, a decision is made to produce the best outputs.
6.
Present the results to the organization. The model, results and the
decision must be presented to the people in the management in a way that it is
easy to understand.
Implement the model and
update it through time. It is not enough to implement the model. The model should be updated
over time in order to meet the changing condirions’ requirements.
Ø Graphical Models
Graphically portray how different elements of a problem
are related – what affect what.
Ø Algebraic Models
Model a set of relationships using algebraic equations and
inequalities.
Ø Spreadsheet Models
Use spreadsheets to implement and visualize the results of
algebraic models.
Communicating The Results
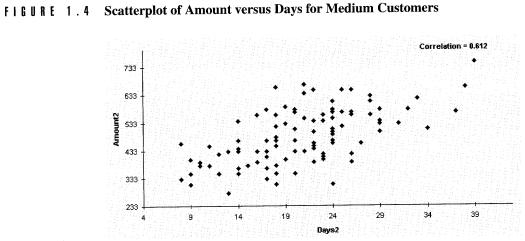
Ø Scatter Plots
Ø
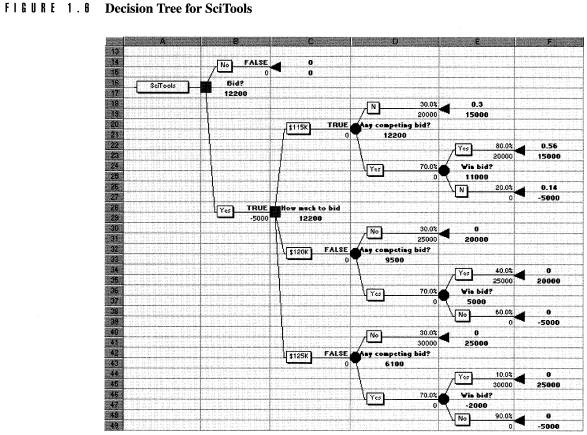
Decision
Trees
Ø Regression Analysis
Ø Time Series Plots
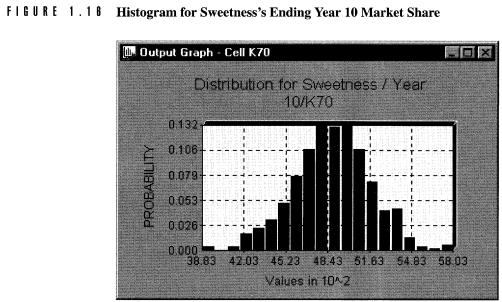
Ø Histograms